Table of Contents
What Are Fundraising Graphics?
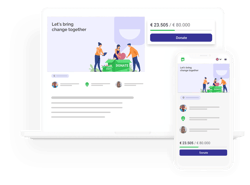
A fundraising graphic is a visual representation of the organization’s fundraising campaign. It can be used to convey the message of the campaign and its goals. A fundraising graphic can be used on social media, websites, and other marketing materials. It can be designed in various formats, such as a banner, poster, or infographic. A well-designed fundraising graphic can help to attract potential donors and increase the visibility of the campaign.
Fundraising graphics are an essential tool for any non-profit organization. They help convey the organization’s message and goals in a visually appealing manner.
These fundraising graphics can be of many types, such as fundraising goal graphics, fundraising progress graphics, and fundraising target graphics.
This article will discuss the top helpful fundraising graphics that can help your organization achieve its fundraising goals.
8 Fundraising Graphics That Can Change The Game
A well-designed fundraising goal graphic can help to motivate donors to contribute more and reach the fundraising goal. So here are the top fundraising graphics that can make your campaign stand out from the crowd.
1. Fundraising Flyer Design
A well-designed fundraising poster or flyer can help promote your event and encourage individuals to take action. It can also raise awareness about the event. The process of choosing the right design elements for the flyer should be carried out by a professional. A fundraising poster should feature vibrant and eye-catching images that are aligned with the organization’s core values. It will catch the eye of potential donors and help promote the event. To make the posters more attractive, customize them according to the type of event.
Read more about Fundraising Flyers here.

2. Fundraising Story Graphics
Did you know that 90% of the information processed by the brain is visual? So don’t just write your campaign story but add visuals of your fundraiser. Show the problems you are going through and the people involved in it. This shows the reality of your story and compels people to give to your cause more likely.
3. Fundraising Thermometer
Measuring the success of your fundraising efforts with a digital thermometer can help you identify areas where you can improve. An animated fundraising thermometer can also be utilized by an organization to keep track of its progress and plan future events. A free fundraising thermometer can be used by an organization to monitor its financial performance and identify areas where it can improve. It can also help its leaders identify areas of potential improvement.
Read more about Fundraising Thermometers right here.

4. Fundraising Bar Chart
A fundraising bar chart is a visual representation of fundraising data using rectangular bars of varying lengths. Each bar represents a specific category or segment, usually depicting different sources of contributions or the progress towards a fundraising goal over time. The horizontal axis typically represents the categories, while the vertical axis represents the amount of funds raised. The length of each bar corresponds to the amount of money raised for the respective category, allowing viewers to compare and analyze the performance of each segment quickly.
One of the primary advantages of using a fundraising bar chart is its ability to showcase the relative strengths and weaknesses of different fundraising channels. For example, if a campaign is utilizing multiple channels, such as online donations, events, and grants, a bar chart can visually highlight which channels are performing well and which may need additional attention. This insight enables organizations to adjust their strategies in real-time, allocating resources to the most effective channels and optimizing their overall fundraising approach.
5. Fundraising Pie Chart
A fundraising pie chart represents the distribution of funds in a circular graph, where each slice corresponds to a specific category or segment of the fundraising campaign. The size of each slice is proportional to the percentage of funds allocated to that category, providing a clear visual representation of how contributions are divided. This type of chart is particularly useful for illustrating the composition of a fundraising campaign in terms of different sources or purposes.
Fundraising pie charts are effective in conveying a holistic view of the overall financial picture. For instance, if a campaign has set a fundraising goal and wants to demonstrate the allocation of funds to different project components or operational expenses, a pie chart can vividly depict the percentage of funds dedicated to each area. This transparency is valuable for donors, stakeholders, and team members, fostering trust and accountability in the fundraising process.
6. Nonprofit Impact Report
Nonprofit impact reports serve as comprehensive documents that illuminate key performance indicators, encompassing metrics such as the breadth of audience reached, the transformative influence on lives, funds successfully raised, and the specific projects undertaken. These reports go beyond statistical data, incorporating compelling narratives featuring individuals or groups profoundly affected by the organization’s initiatives.
Nonprofit impact reports transcend the role of mere documentation. They emerge as powerful instruments for showcasing an organization’s impact, cultivating financial support, and catalyzing transformative change. By weaving together narratives and evidence, these reports not only articulate past successes but also chart a course for future endeavors, inspiring stakeholders and donors to actively participate in advancing positive change on a global scale.
Know more about NonProfit Impact Reports here.
7. Impact Story Graphics
Fundraising success stories are compelling narratives that showcase the positive impact of donor contributions on individuals, communities, or causes. These stories serve as powerful testimonials, illustrating the tangible difference made possible through philanthropic support. However, incorporating visuals into these narratives elevates their impact significantly.
Visual elements, such as photographs, infographics, or charts, enhance the emotional connection between donors and the cause. A striking image of a beneficiary, a graph depicting the increase in funds raised, or an infographic illustrating project milestones can convey complex information more effectively than words alone. Visuals provide a vivid and immediate representation of the transformative outcomes, making the success story more relatable and memorable.
A picture tells a thousand stories. Let your donors SEE their impact—design stunning graphics now and turn supporters into long-term champions!
8. Thank You Card Graphics
Integrating visuals into thank-you cards for donors is a strategic and thoughtful approach that transcends traditional expressions of gratitude. Beyond mere words, visuals have the power to convey a deeper appreciation and leave a lasting impact on a donor’s mindset.
Visual elements, such as personalized passover images, graphics, or illustrations, add a tangible and memorable dimension to the gratitude expressed. A well-chosen visual might showcase the donor’s generosity’s direct beneficiaries, illustrating their contribution’s real-world impact. This personalized touch not only reinforces the significance of the donor’s support but also humanizes the charitable cause, forging a stronger emotional connection.

9. Social Media Fundraising Graphics
In today’s digital world, social media fundraising graphics are your nonprofit’s megaphone. These visuals stop scrollers in their tracks and turn passive viewers into active donors. The most effective social media graphics include:
- Campaign Teasers: Short, punchy visuals that build anticipation before a big fundraiser launch.
- Donation Milestones: Celebratory posts when you hit 25%, 50%, or 75% of your goal (bonus points for confetti graphics!).
- User-Generated Content: Repost donor selfies or videos with your campaign hashtag to build community.
Pro Tip: Stick to platform-specific sizes—Instagram loves squares (1080×1080px), while LinkedIn performs best with horizontal graphics (1200×627px).
10. Animated Fundraising Graphics
Static images are great, but motion grabs attention. Animated fundraising graphics can increase engagement by up to 300% (HubSpot). Try these dynamic formats:
- Progress Thermometer GIFs: Show your fundraising bar rising in real-time.
- “Donate Now” CTA Animations: Subtle arrows or pulsing buttons guide eyes to your donation link.
- Impact Story Videos: 15-30 second clips featuring beneficiaries (“Watch how your $50 changed lives”).
Tool Alert: Use free apps like Canva (for simple animations) or LottieFiles (for lightweight, interactive designs).
Add Your Fundraising Graphics To Your WhyDonate Fundraising Page
Create a fundraiser with WhyDonate in minutes and add visuals to your campaign page to see the effects. WhyDonate’s fundraising website is one of the most trustworthy global platforms, allowing everyone to create campaigns for immediate financial needs. The platform charges no registration fees and fewer transaction fees than any of its contemporaries. WhyDonate is trusted by over 40,000+ fundraiser owners, charities, schools, churches, and individuals worldwide, who have raised over $25 million with the platform.
Conclusion
In conclusion, fundraising graphics are an essential tool for any nonprofit organization. They help to convey the message of the organization and its goals in a visually appealing manner. A well-designed fundraising graphic can help to attract potential donors and increase the visibility of the campaign. By using these graphics, you can motivate donors to contribute more and reach the fundraising goal.
Ready to boost your fundraising impact? Start creating compelling visuals today & start fundraising with WhyDonate – engage donors and grow your campaign!


